


Bill Ackman's 2,650,000,000 trade
How Bill Ackman turned $27mm into $2,650,000,000 betting on a downturn

In 2020, after Covid-19 broke out and the world fell into panic, Bill Ackman saw an opportunity and stepped up. He put on a trade in February 2020 and within a short time period, turned $27mm into $2,600,000,000 betting on a downturn.
This blog will tell this story.
The Timeline
On Feb 27th 2020, Bill Ackman sent his employees to work from home.
This action shows how early Bill was within the unfolding of events as it took until March 11, 2020, after more than 118,000 cases in 114 countries and 4,291 deaths, for the WHO declares COVID-19 a pandemic.
The market however, would show just how serious this crisis was becoming.
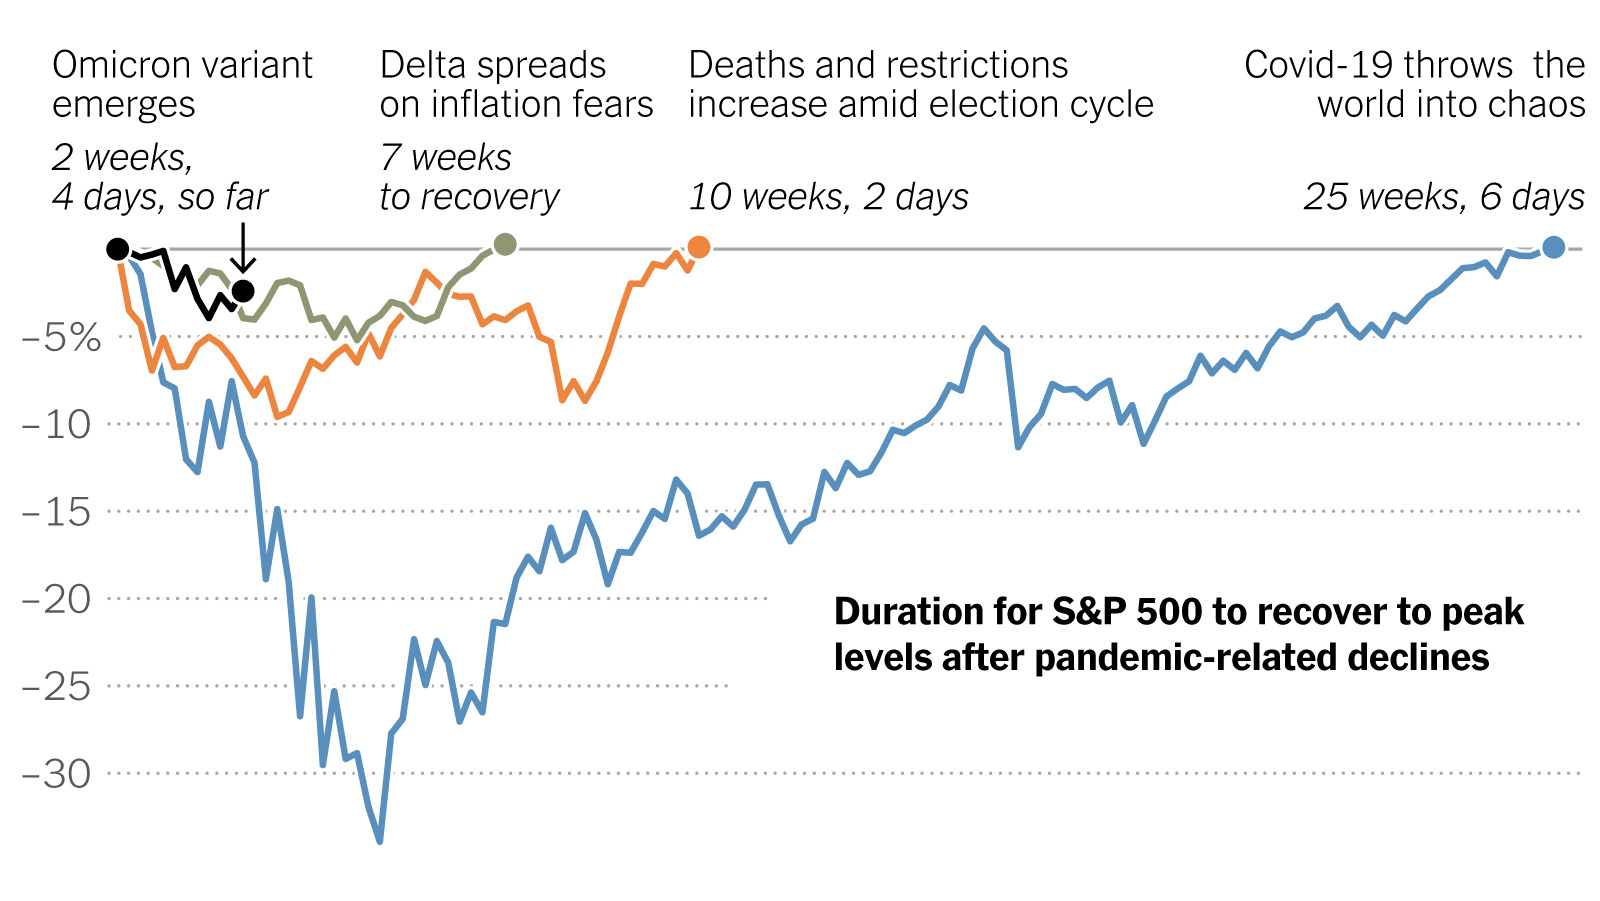
The market topped on February 20th 2020 at 3397.5 and retraced -36% during 32 atrocious days to bottom on 2174 on March 23rd.
4 days later, on March 27th 2020, The Trump Administration would sign the Coronavirus Aid, Relief, and Economic Security (CARES) Act into law. The act included funding for $1,200 per adult, expanded unemployment benefits, forgivable small business loans, loans to major industries and corporations, and expanded funding to state and local governments in response to the economic crisis caused by COVID-19.
Within this chaos, Bill Ackman would put on his best trades ever.
In the middle of the trade
At the start of 2020, when the world went into lockdown through the spread of Covid-19, Bill Ackman had a clear message.
“hell is coming”
He was featured on CNBC by calling call on March 18th 2020, explains his view over the virus.
At the time he made the call, his major bet had been working for the past weeks and he was already looking at a win ranking in the billions.
His thoughts were laid out on twitter right before his call as well.

The Bet: CDS
Bill Ackman would structure his bet using an instrument he had no experience with.
To express his view of an impending strong crisis, he decided to bet against investment grade bonds in the USA and Europe as well as High yield bonds (lower quality US debt).
U.S. Investment Grade Bonds are bonds issued by corporations, government-sponsored enterprises, or government entities in the United States that are considered to have a relatively low risk of default.
U.S. High Yield Bonds, often referred to as "junk bonds," are debt securities issued by corporations or entities with lower credit rating.
How do the Credit Default Swaps work?
Here is a quick overview of the most important aspects of the CDS:
Parties: CDS involves a buyer seeking credit risk protection and a seller providing it.
Contract Terms: They agree on notional amount, CDS spread (premium), and maturity date.
Reference Bonds: Specific U.S. Investment Grade Bonds are identified as reference securities.
Premium Payments: The buyer pays annual premiums to the seller.
Protection: If a credit event (like bond default) occurs, the buyer can invoke the CDS.
Payout: An independent committee determines payout based on bond market value at the time of the credit event.
Termination: The CDS contract ends either at maturity or by agreement.
The bet structure

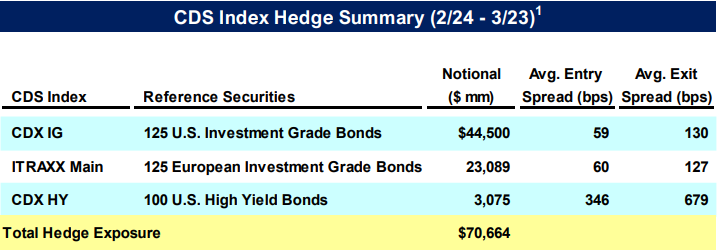
He would buy a national value of $70,664,000,000 put together through CDS on:
•62.9% in CDX IG 125 U.S. Investment Grade Bonds
•32.67% in ITRAXX Main 125 European Investment Grade Bonds
•4.43% in CDX HY 100 U.S. High Yield Bonds
The bet timing
The most important aspect of this bet is the timing.
After all the trade returned a 100/1, a dream for any trader and investor. So how did he manage to return such an insane return?
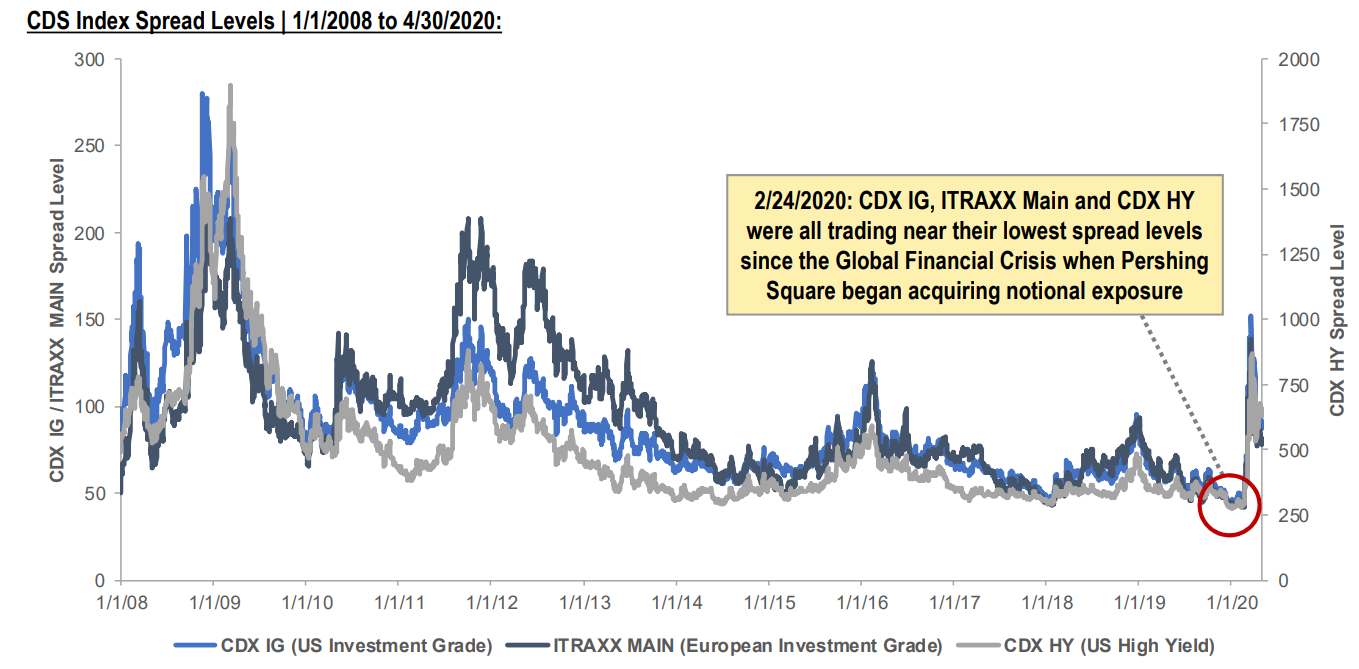
CDS on Investment grade bonds as well as high yields were trading near their lowest level in a decade. This lower prices created an asymmetric reward if companies started to default on their debt or even if the risk of defaulting increased.
The following shows just how cheap the risk could be hedged.

CDS contracts are expensive. What allowed him to pay a mere $27mm for this major windfall is the way CDS are structured and the duration of his trade.
CDS are paid for based on time. That is the appeal for the sellers, selling insurance against a very low odds event.
Bill Ackman only stayed in this trade for 1 month! This allowed for the cost of the CDS to remain minimal. In short this is the best timed trade of his entire career which led to small costs which would have otherwise added up quickly and through the magnitude of the crisis, led to a massive gain.
The $2,650,000,000 profit.

The hardest part of this trade is to understand just how this trade led to the profit as CDS gains are calculated in a different manner than normal equity, option and alike trades.
I took it upon myself to calculate the exact math in the following, keeping in mind I had to approximate certain time and price elements.
First of all I used the information that Pershing Square gave us in their Investor letter.
This gives us insight into the entries and exits as well as the sizing of each bet.
Let is now dig into the math.
How to Calculate a CDS profit/loss
Here is how to approach the calculation of Credit Default Swap (CDS) gains and losses:
Calculate the present values of the CDS's monthly premiums and add them together. This represents the CDS's current value before any changes in credit spreads. The monthly premiums are determined by multiplying the initial credit spread by the notional amount.
After changes in credit spreads occur, calculate the present values of the CDS's monthly premiums and sum them. This gives you the CDS's current value after the credit spread adjustments.
Determine your profit or loss by subtracting the present value of the CDS after the credit spread changes from the present value of the original CDS.
If credit spreads have widened, your profit should be positive since the CDS's present value after the spread increase is higher. Conversely, if spreads have tightened, expect a negative profit, as the CDS's present value after the spread reduction is lower. These steps illustrate how investors can make gains or losses through CDS contracts.
Important to note here is that most CDS have a 5 years contract limit.
For the trade we will use a 1.5% discount rate which was the yield on the 30y bonds at the time and the highest yield we could get as the panic set.
We know through the 1 month duration of the trade that the monthly cost of the CDS was $27,000,000
The Trade math
Ackman’s CDS Valuation
Applying the numbers from Ackman’s trade to the CDS valuation we laid out can help us understand his large profit.
average spread x total notional exposure x 5
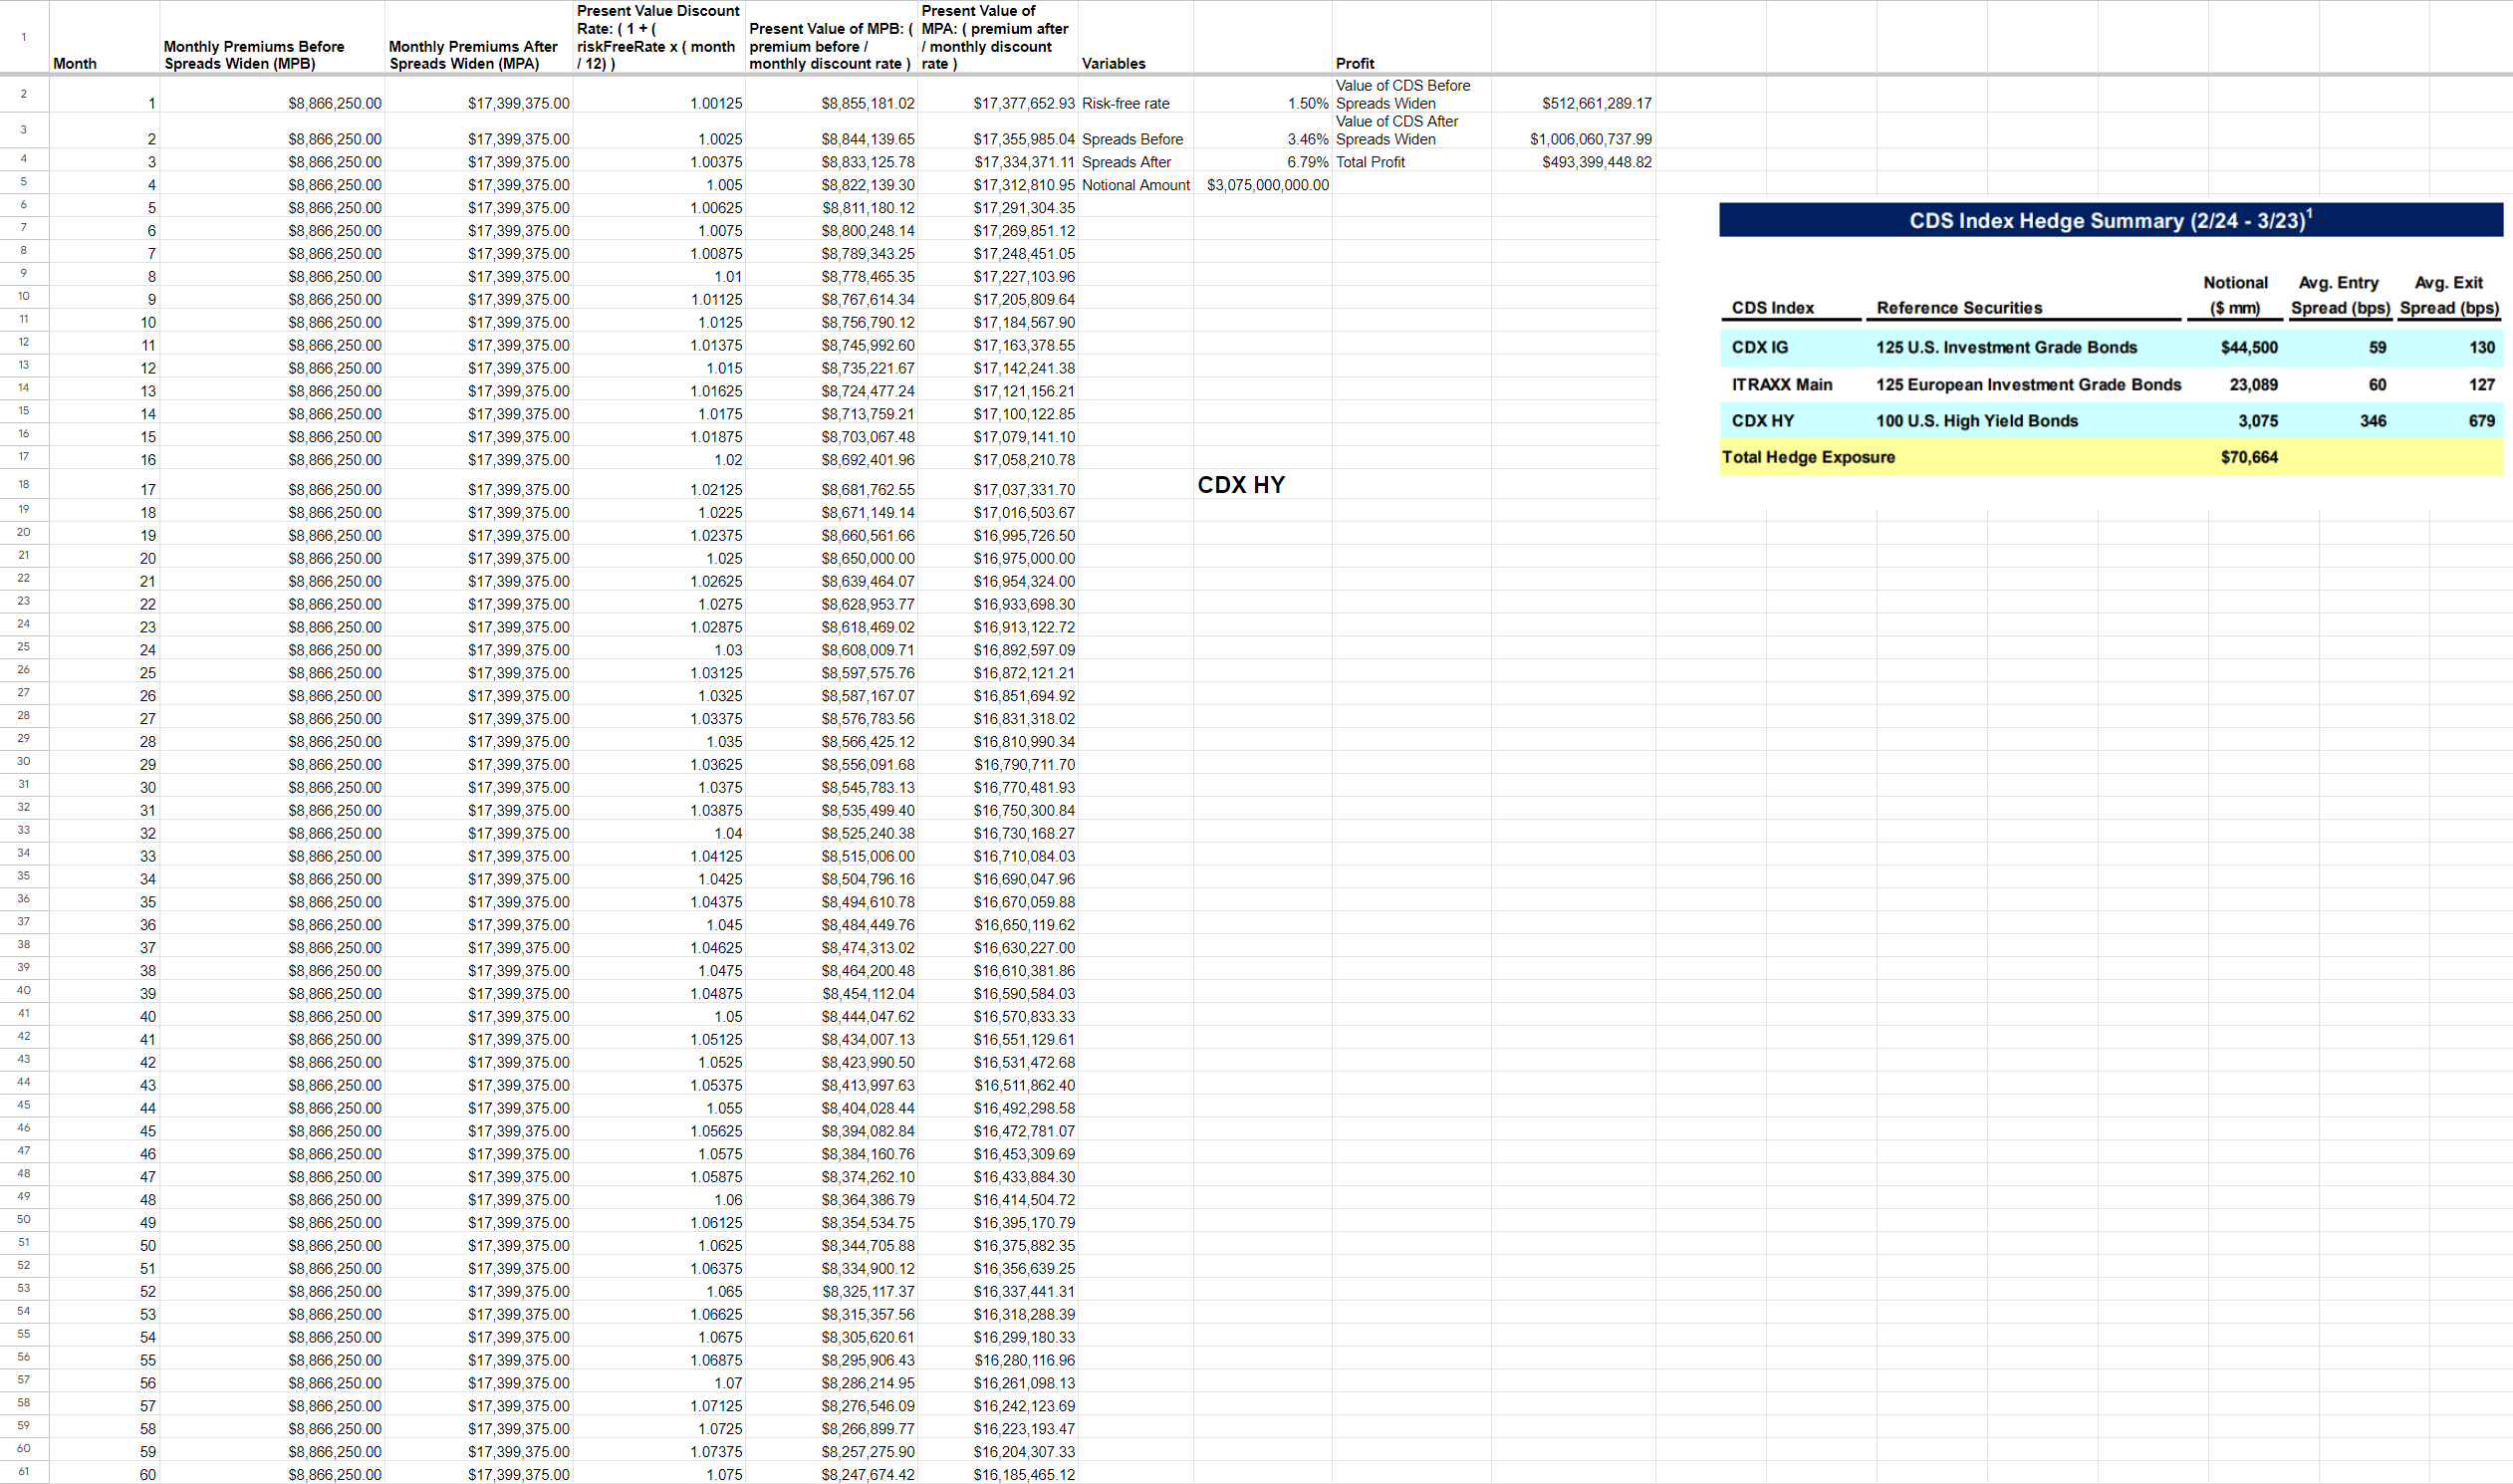
Discount the starter position premium of $27 million by the monthly discount rates. Then, add up all 60 months of the different monthly premiums to get the discounted value using each asset class used.
This amounts to about $2,445,273,164
Now using the same equation we calculate the value of the CDS contracts for the exit spread as laid out in the picture above and discount in the same manner as point nr.2.
Total cost of CDS contract after spreads widened is about $5,206,468,458.32
Subtract them: $5,206,468,458– $2,445,273,164 = $2,761,195,293
Ackman’s profit is about $2.75 billion
Now important to note is the actual profit was $2.65b as stated by Ackman in his shareholder letter. This could have happened through the spread, the exact exit average, the discount rate and alike.
Despite this slight divergence, we find ourselves within 3.5% of the total stated by Pershing square.
Here is the math in more detail as well as the spreadsheet I used:
CDX IG

ITRAXX MAIN

CDX HY
GRAND TOTAL

Final thoughts
Now that we went through the trade itself, I want to mention a few things that are important and impressive to me.
First of all Bill Ackman and his team absolutely nailed the timing on both the entry and the exit. They entered as the CDS started to move up.
Especially on the investment grade bonds, they managed to build a sizeable position at the dead bottom for both the CDX IG and ITRAXX Main which is what they had size on and entered first.
The high yields was entered later which also shows through the smaller size but was managed well nonetheless. The HY bonds were also exited earlier than the rest.
To me this very clear choice of 80% of the size behind concentrated in Investment grade bonds shows that Bill Ackman studied the 2008 CDS/CDO crash. During that crisis, the biggest money was made in exactly that grade/tranche of CDS and not on the high yield bonds CDS.
Overall this was well studied, perfectly executed and something that will go down in the history books. Many did not understand how this trade was structured, including myself until now because of the CDS component.
Great share!
Great article. What I find most interesting was his choice of vehicle to express this trade. I’ve often wondered, and admit, I’ve not done any homework on this, but what were the best ways to express this view. I had a calendar straddle (3m put, 1m call) which did well but not that well. But was psychologically easy to manage and allowed for my timing to have been early. The element I find most intriguing was the conviction on the timing. Anyway. Thanks for the work on this.